In EMS, we have a few diagnostic tools. A 12-lead ECG is one of them. The goal of this study guide is to lay the foundation for how you interpret each 12-lead ECG you run on your patients. This is by no means the end-all, be-all guide for 12-leads. Reading and interpreting a 12-lead ECG takes hundreds of repetitions and lots of study time. As always, follow your local protocols. No piece of information found on our website is ever meant to be a substitute for the protocols by which you operate in your department/agency.
Axis Determination
Why do we care about axis determination?
A shifted axis may indicate:
- Infarct
- Hypertrophy
- Conduction delay
- Actual physiologic movement of the heart (pregnancy)
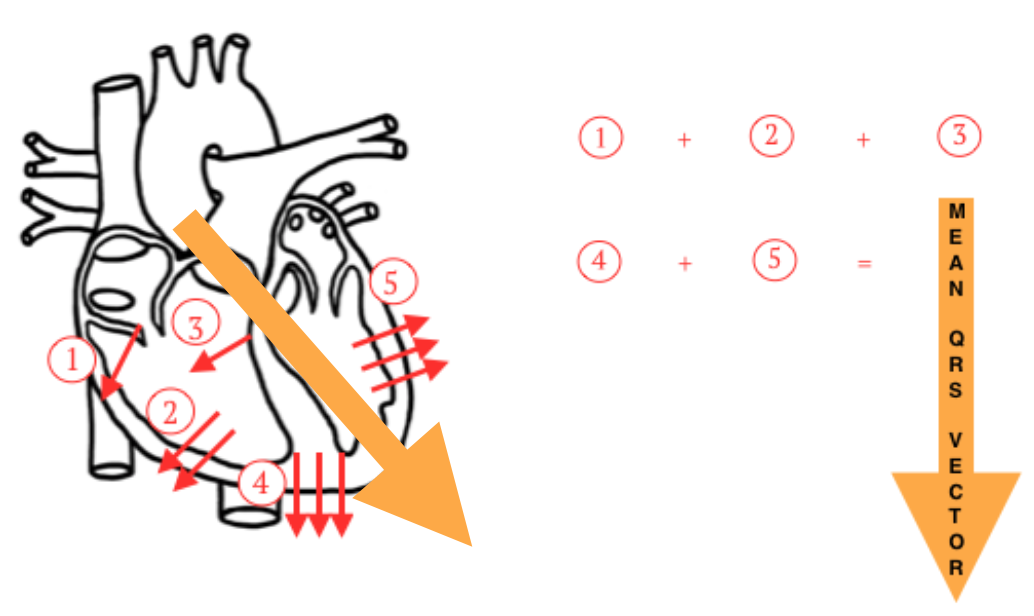
Vector Calculus (in a nutshell):
- Vector: unit that has both magnitude and direction
- All vectors can be added together to determine the overall direction and magnitude
Mean QRS Vector: all electrical impulses of the ventricles added together
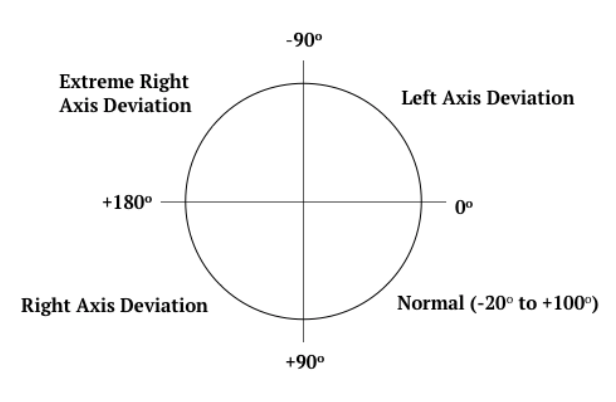
Axis
Once you have figured out the mean QRS vector, you can apply it to the figure below in order to determine which sector the heart’s axis is in:
Major Causes of Axis Deviation
LAD
- LBBB (Left Bundle Branch Block)
- LVH (Left Ventricular Hypertrophy)
- Pregnancy
- Ascites
- Abdominal Tumors
RAD
- RBBB (Right Bundle Branch Block
- RVH (Right Ventricular Hypertrophy)
- Emphysema
HYPERTROPHY = added muscle = more vectors = more electricity
Change of Axis due to Infarct
- Infarct = dead muscle
- Dead muscle = no longer conducts electricity (fewer vectors)
- Fewer vectors will change the QRS axis
*** Side note: There are P-wave and T-wave axis’ but we don’t care about those! ***
Identifying Axis’
- Find the most “positive” lead (closest to the axis)
- Find the most “negative” lead (furthest from the axis)
- Find the most “biphasic” lead (perpendicular to the axis)
R-wave Progression
- The heart is three-dimensional
- The QRS vector can be pointing in or out
- We need to examine what normal looks like to identify “poor R-wave progression”
Normal R-wave Progression
- A steady progression of the QRS complex from “mostly negative” to “biphasic” to “mostly positive is considered normal
- R-wave progression is observed in leads V1-V6
- Negative QRS Complexes: V1 & V2
- Biphasic QRS Complexes: V3 &V4
- Positive QRS Complexes: V5 & V6
*** Any deviation from this natural progression is considered abnormal, or poor R-wave progression ***
- Several causes of poor R-wave progression:
- Anterior myocardial infarction
- Left bundle branch block
- Wolff-Parkinson-White Syndrome
- Right Ventricular Hypertrophy (RVH) or Left Ventricular Hypertrophy (LVH)
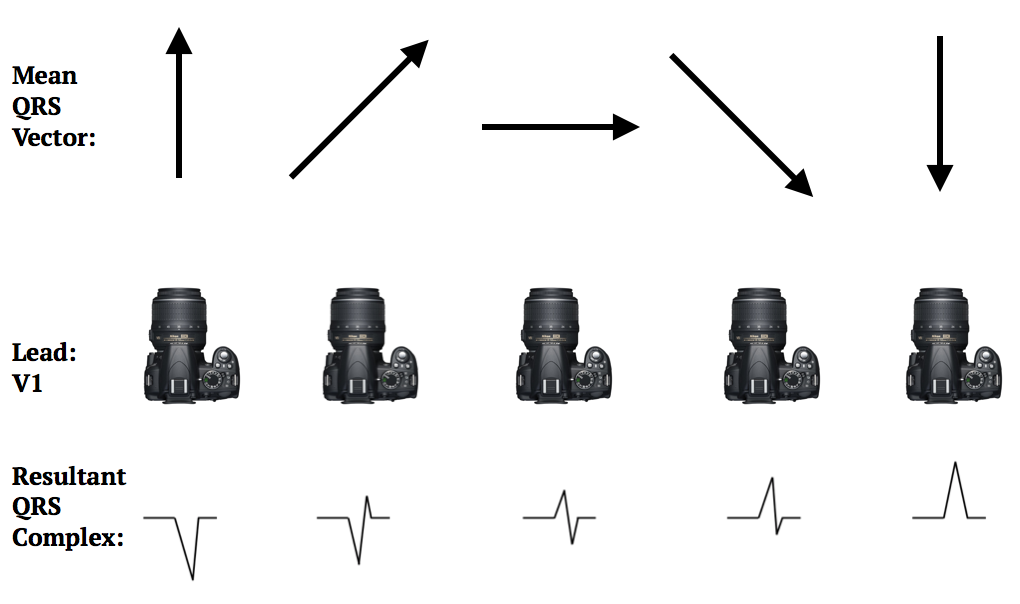
What causes a QRS complex to be “negative”, biphasic, or “positive”?
- Every heart has its own variation in QRS vector axis. So, depending on the mean QRS vector axis, each lead will see a “negative”, "biphasic", or “positive” QRS complex.
- For example, imagine that the camera below is Lead V1. Depending on the magnitude and direction of the mean QRS vector, V1 will show a different QRS complex:
How to Read a 12-Lead
Reading a 12-lead should take you roughly 1 minute and incorporate the following steps (in order):
- Rate
- Rhythm
- Axis Determination
- R-wave Progression
- ST-segment Changes
- T-waves
- Q-waves
- Reciprocal Changes
Injury Patterns
- Look for regional changes in 12-leads (to rules out bad lead placement)
- Three things to look at regarding injury patterns:
- ST-segments
- T-waves
- Q-waves
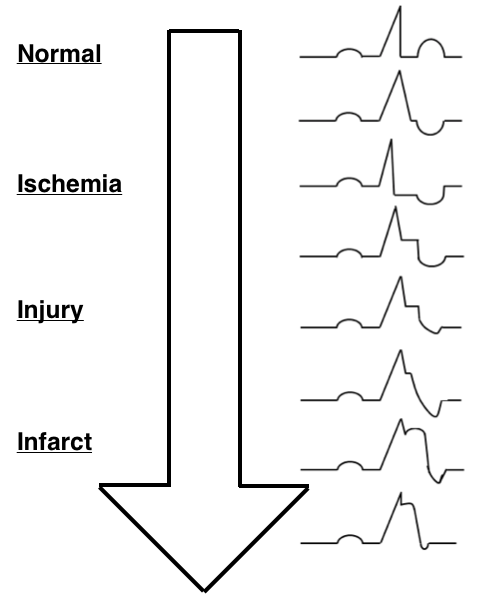
Ischemia
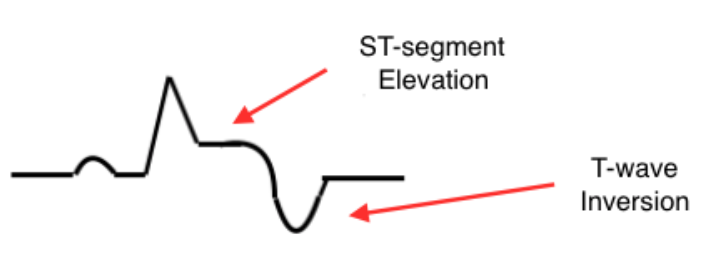
- ST-depression and flipped T-waves indicate that a portion of the heart is not receiving enough oxygen
- If untreated, this will progress to injury
Injury
- ST-elevation indicates that the myocardium has been without oxygen for some time, and is beginning to suffer
Infarct
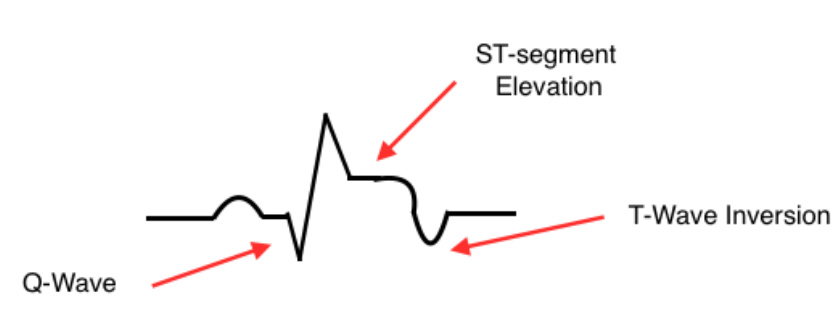
- ST-elevation also signifies death of the tissues due to a prolonged lack of oxygen
- Q-waves are a “scar”
- Pathological Q-waves: Width > 1mm AND Depth > 1/3 total height of the QRS
Reciprocal Changes
- Reciprocal changes are definitive changes that are seen 180 degrees from the lead in question
Remember the contiguous leads chart?
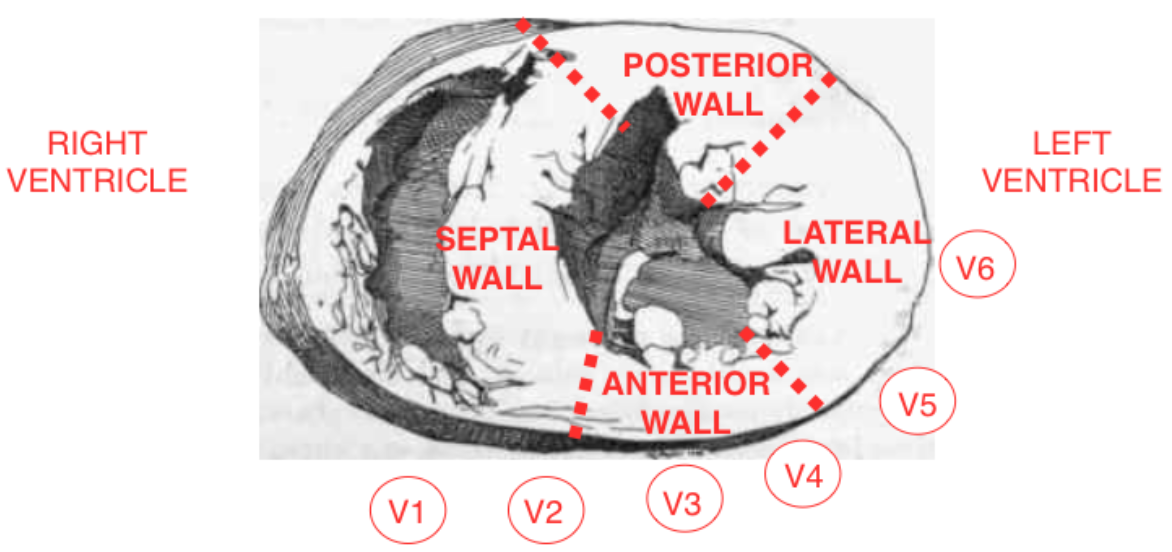
- Inferior leads: II, III, and aVF look at the inferior wall of the left ventricle
- Septal leads: V1 and V2 look at the septal wall of the left ventricle
- Anterior leads: V3 and V4 look at the anterior wall of the left ventricle
- Lateral leads: I, aVL, V5, and V6 look at the lateral wall of the left ventricle
- I and aVL are referred to as high lateral leads because their “positive” electrode is on the left shoulder
- V5 and V6 are referred to as low lateral leads because their “positive” electrode is on the left lateral chest
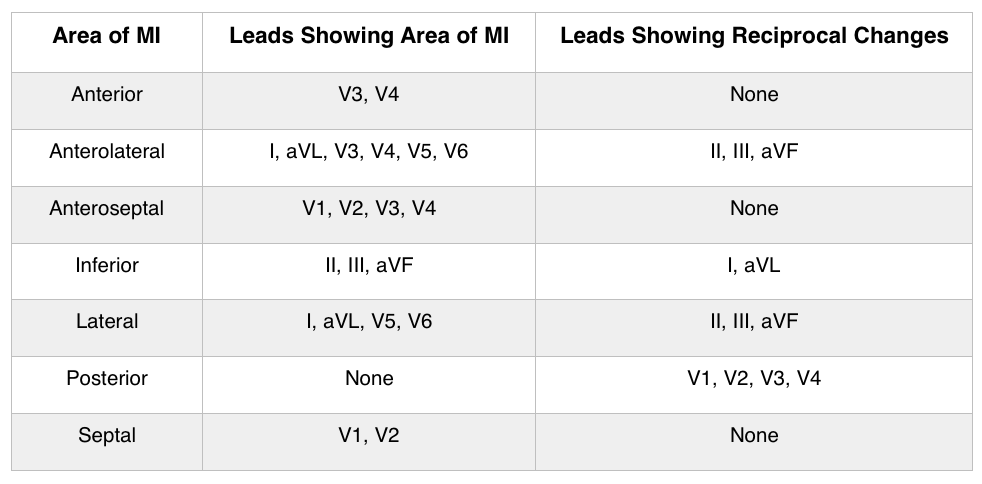
Reciprocal Change Chart
Myocardial Infarction
- Death of heart muscle due to an inadequate blood supply
- Myocardial cells need oxygen to survive.
- Without oxygen, the myocardial cells switch to anaerobic metabolism.
- Anaerobic metabolism creates acidosis which leads to cardiac cell injury and eventually death of cardiac cells
Myocardial infarctions develop for one of two reasons:
- An increase in demand
- A decrease in supply
Major Causes of Myocardial Infarction
- Thrombi
- Coronary Artery Spasm
- Acute Volume Overload
- Hypotension
- Microemboli
- Acute Respiratory Failure
- Trauma
*** The location and size of the myocardial infarction will depend on which coronary artery is involved and the site of the obstruction. ***
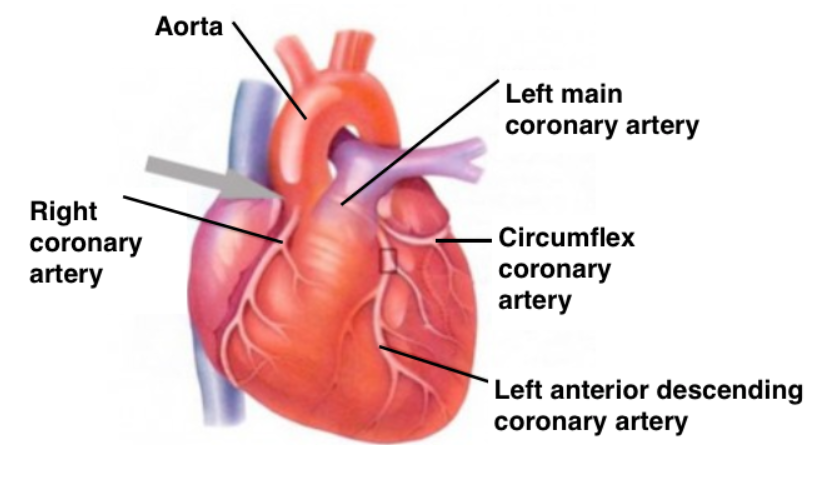
Heart Anatomy
Previously, we reviewed the injury cascade that occurs to cardiac tissue when it is deprived of oxygen. Why do we see those injury patterns show up the way they do?
Ischemia Patterns
- The area of ischemia is more “negative” than normal tissue which causes a pattern of ST-depression
- The T-wave is flipped because repolarization of the ventricles is abnormal
Injury Patterns
- The area of injury/infarction does not depolarize completely, leaving it more “positive” than normal which causes ST-elevation
Infarct Patterns
- The infarcted area acts as an electric window and an electrode can see through to the vector on the other wall, causing the Q-wave
Reciprocal Changes
- Mirror image that occurs when 2 electrodes view the same MI from the opposite angle
Example: A STEMI with ST-elevation in leads II, III, and aVF would expect to see ST-depression in lead I and aVL
Right-sided MI
- In general, these patient’s will have lower blood pressures (systolic less than 140 mmHg)
- With right heart failure, blood backs up into the venous side causing the blood pressure to drop
*** Strongly consider withholding nitroglycerin to these patients!!! ***
Posterior MI
- Look for ST-depression and larger than normal R-waves in leads V1 and V2
Pericarditis
- If you see global ST-elevation in the 12-lead, think pericarditis before massive STEMI.
Want more information on interpreting 12-Lead ECGs? Check out our YouTube video, by clicking HERE.
- Dozens of courses and topics
- State-specific requirements
- We report to CAPCE in real time


